Attribute Inference
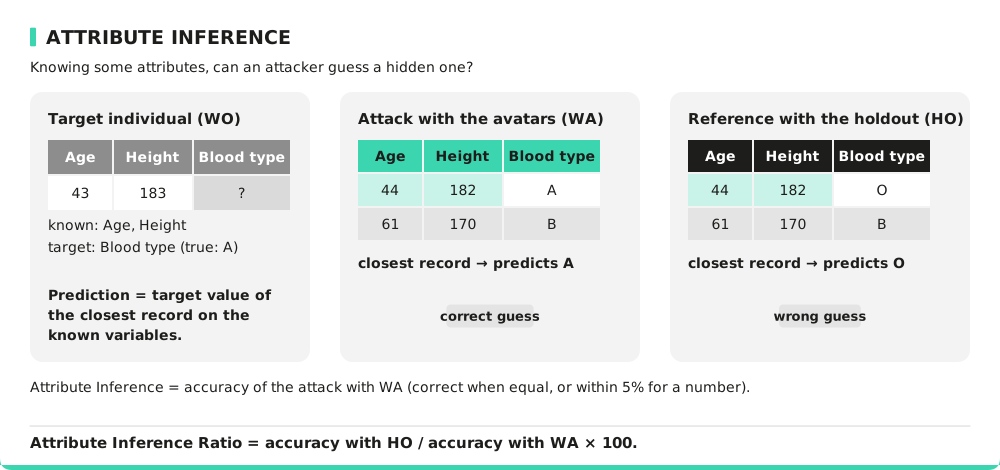
The Attribute Inference metric evaluates the risk that an attacker could successfully deduce the value of a target variable using a subset of known attributes.
An inference is considered successful when the predicted modality matches the true modality for a categorical variable, or when the predicted value is sufficiently close to the real value for a continuous variable (~5%).
In practice, each individual is assigned the target value of the synthetic record that is most similar in terms of attribute proximity. The resulting prediction performance constitutes the Attribute Inference score.
This metric is particularly relevant in attribute inference attack scenarios, where adversaries leverage publicly available or easily accessible demographic data to infer sensitive categorical information about individuals.
Inferred correlation and attribute inference in synthetic data
This risk is broader than membership inference. It concerns the ability to infer a sensitive attribute about a person even when there is no direct identifier, no direct row match, and no explicit linkage to a name or record in the source data. The attack leverages statistical correlations preserved by the synthetic data or by a model.
The essential point is that synthetic data can keep micro-correlations that are real in the original population. Even where there is no direct one-to-one mapping, a small set of known attributes can be used to identify a narrow subpopulation in which a hidden attribute is overwhelmingly likely.
Example A: inferred financial attribute from a synthetic dataset
- Context: a bank generates a synthetic dataset reflecting customer financial behavior for a risk-analysis hackathon.
- Attacker knowledge: the attacker knows that Valérie is 34, lives in Cesson-Sévigné, is an engineer, and has two young children.
- Attack: the attacker filters the synthetic dataset to the intersection: age 30–35, location Cesson-Sévigné, profession engineer, children = 2.
- Result: within that very narrow group, 98% of the synthetic records show a high debt ratio or credit purchase pattern.
- Conclusion: the synthetic data preserves a real correlation specific to a small subgroup. The attacker can infer with near-certainty that Valérie is over-indebted, even though neither her name nor her identifiers were directly transmitted.
Example B: prompt-based inference on an AI model
- Context: a company trains an internal LLM on performance reviews and manager notes to assist HR in drafting job descriptions.
- Attack: an employee submits the prompt: “Draft a summary of the managerial feedback for a senior project manager in the Marketing team, who joined the company in 2022 and had a long sick leave in the spring.”
- Result: the model generates text that reconstructs highly specific elements of the real evaluation of one individual, revealing a medical or personal situation that was never intended to be disclosed.
- Legal and technical interpretation: the prompt uses secondary attributes to isolate a highly specific individual. The model is effectively leaking a sensitive attribute via statistical completion.
This is the core challenge for synthetic data: when the synthetic output is too faithful to the underlying population, it preserves the micro-correlations that enable membership and attribute inference. When it is too smooth, it may lose utility for analysis and ML applications. A robust anonymization evaluation therefore needs to demonstrate that such inferences are no longer realistically feasible in context, not simply that there is no direct one-to-one mapping.
Comparison Strategy (Holdout)
To improve interpretability, this metric is divided into two sub-metrics:
- Attribute Inference: evaluates the inference risk for a given target variable as described above.
- Attribute Inference Ratio: compares the inference performance obtained using avatars against that of a reference model.
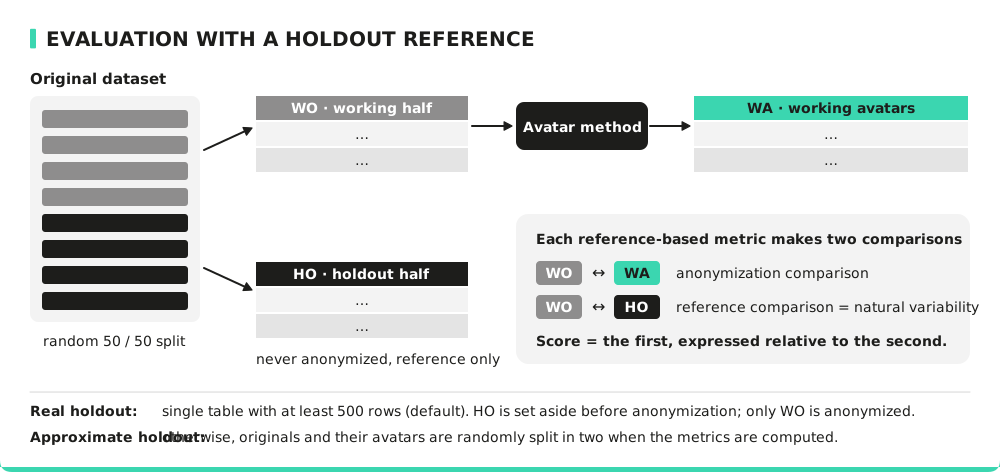
The Attribute Inference Ratio is reference-based: it compares inference using the anonymization (WO vs its avatars WA) against inference using the natural variability of the real data (WO vs a held-out reference HO).
- WO — working half original: the part of the original data that is anonymized.
- WA — working avatars: the avatars generated from WO.
- HO — holdout half original: a second, untouched sample of real records, used only as a reference.
On datasets large enough (by default ≥ 500 rows) a real holdout is set aside before anonymization; on smaller ones an approximate holdout is drawn by randomly splitting the data when the metrics are computed. See the "Evaluation with a holdout reference" section in the Technical Assessment report.
The comparison is performed using the following steps:
- Obtain the working half WO and a disjoint holdout half HO from the real data (a real or approximate holdout — see the note above).
- Take the working avatars WA, generated from WO.
- Compute the Attribute Inference metric on WO using WA as the attack base.
- Compute the Attribute Inference metric on WO using HO as the attack base.
- Compute the ratio between the two resulting performance scores.
Metric Interpretation
The Attribute Inference metric is expressed as the accuracy of the attacker (in %):
- A value of 0% means that no inference by the attacker succeeded.
- Higher values indicate higher attacker accuracy and thus a greater inference risk.
Unlike the other privacy metrics, lower values mean stronger privacy protection for this metric.
The Attribute Inference Ratio is interpreted as follows:
- A value close to 100% indicates that inference performance using avatars is similar to that obtained using real data. The anonymization process does not increase inference risk.
- A value below 100% means that avatars increase the attacker’s ability to correctly infer the target variable.
If the Attribute Inference value is 20%, attackers correctly predict the target for 20% of individuals, which corresponds to a low inference risk.
Conversely, a value of 90% means attackers reach 90% accuracy, indicating a high inference risk and the need for further privacy-enhancing adjustments.
If the Attribute Inference Ratio is 50%, this means that using avatars doubles the attacker’s capacity to correctly infer the target variable compared to using real data.
Metric Specificity
These metrics are essential to assess the ability of the Avatar method to protect against attribute inference attacks.
For proper interpretation, both Attribute Inference and Attribute Inference Ratio must be considered together.
For example, the Attribute Inference Ratio may indicate that avatars significantly increase attacker performance, yet if the Attribute Inference score remains low, the overall inference risk can still be low.
Formula
The known variables are projected (factor analysis fitted on , components). For each working original , the prediction is the target value of its nearest neighbour in the attack base (, or for the reference). A prediction is correct when
(for , the tolerance is times the mean absolute non-zero target). Then
The ratio is not defined when .
How to Improve This Metric?
To improve these metrics, begin by identifying the demographic variables that are most predictive of the target variable.
Next, analyze whether groups of individuals sharing key demographic attributes tend to exhibit similar target values.
If such clusters exist, the k parameter (the number of neighbors used during synthetic data generation) should be set to a value greater than the size of these clusters.
This increases variability among individuals with similar target values, reduces inference risk, and lowers the attacker accuracy reported by the metric—thereby strengthening privacy protection.