Multivariate Hellinger Distance
The Hellinger distance is a statistical measure used to quantify the similarity between two probability distributions. It builds on the concept of the Hellinger distance and applies it to the distributions along projection axes, weighted by the percentage of variance explained by each axis. It measures the distance between the Probability Mass Functions (PMFs) of the original dataset and its synthetic counterpart. The distance ranges from 0 (identical distributions) to 1 (completely disjoint distributions).
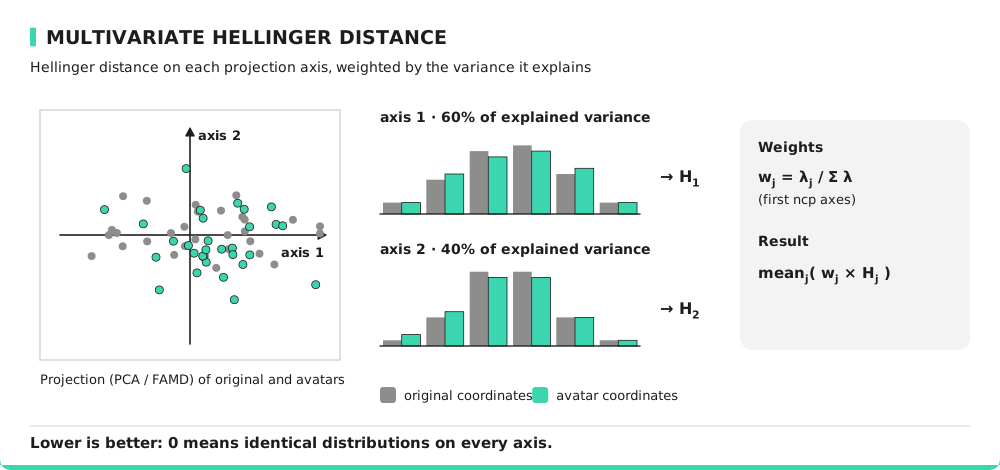
Interpreting Hellinger Distance
A low Multivariate Hellinger Distance indicates that the multivariate structure of the anonymized dataset is similar to that of the original data. Higher values suggest that the relationships between variables have been statistically altered, which may affect the usability of the data.
Typically:
- A value above 0.1 suggests that distributions on projection exis are almost identical.
- A value between 0.1 and 0.3 suggests high fidelity of the generated data.
- Values above 0.3 indicate distortions due to a lack of fidelity.
Consider a dataset in which three distinct clusters of individuals can be identified, each characterized by significantly different values across a set of variables. A low Multivariate Hellinger Distance will indicate that this cluster structure has been well preserved. Conversely, a high distance will suggest that this information has been altered or even lost.
Metric Specificity
Advantages:
- Captures the preservation of multivariate clustering statistics.
- Not sensitive to dimensionality, as it computes a weighted average of distances per dimension based on the percentage of variance explained.
- Provides a bounded measure between 0 and 1, making it interpretable.
Limitations:
- Less sensitive on datasets with weak or no clear structure.
Formula
Original and avatar data are projected on the same model. With the share of variance explained by component , over the components that explain some variance:
where is the binned distribution of the coordinates on component and the Hellinger distance. The reported value is the mean of the weighted distances:
How to Improve This Metric?
To reduce the Multivariate Hellinger distance and enhance similarity, you can adjust parameter k to help align distributions more accurately. You can also apply weighted projections by assigning higher importance to critical variables during data generation. Finally, you can use targeted data processing by apply transformations based on variable characteristics.