Closest Distances Ratio
The Closest Distances Ratio is a local density metric.
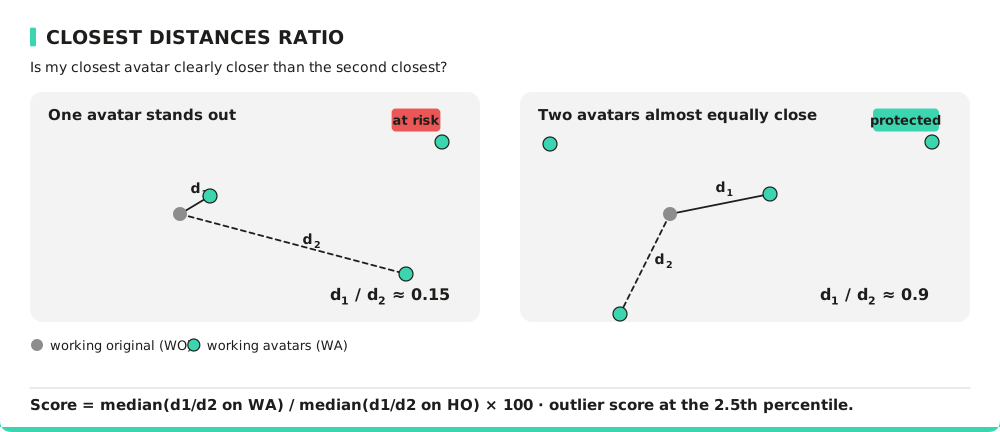
It computes the median ratio between the Euclidean distance separating an individual from their closest avatar, and the distance separating that same individual from their second closest avatar.
For interpretability, this value is compared to a reference value.
The final score is the ratio between the Closest Distances Ratio computed on the avatars and the one computed on a reference dataset.
This comparison makes it possible to evaluate whether avatars reproduce a local density around original individuals that is similar to what is observed in the reference data.
The approach is also applied to outliers, by computing the Closest Distances Ratio for individuals who exhibit low local density (isolated points).
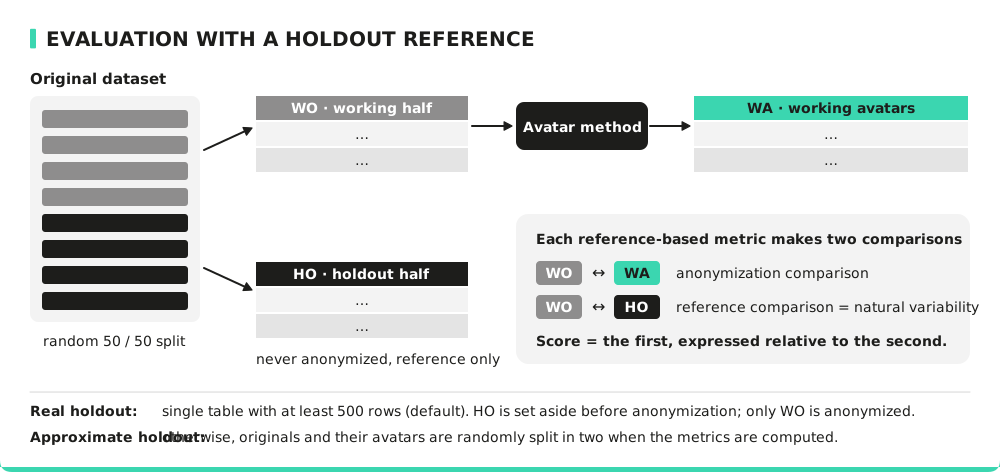
This is a reference-based metric: it compares the anonymization (WO vs its avatars WA) against the natural variability of the real data (WO vs a held-out reference HO).
- WO — working half original: the part of the original data that is anonymized.
- WA — working avatars: the avatars generated from WO.
- HO — holdout half original: a second, untouched sample of real records, used only as a reference.
On datasets large enough (by default ≥ 500 rows) a real holdout is set aside before anonymization; on smaller ones an approximate holdout is drawn by randomly splitting the data when the metrics are computed. See the "Evaluation with a holdout reference" section in the Technical Assessment report.
Comparison Strategy (Holdout)
To compute the final score returned to the user, we perform the following steps:
- Obtain the working half WO and a disjoint holdout half HO from the real data (a real or approximate holdout — see the note above).
- Take the working avatars WA, generated from WO.
- Compute the Closest Distances Ratio on WO using WA as the attack base (both median and outliers).
- Compute the Closest Distances Ratio on WO using HO as the attack base (both median and outliers).
- Compute the ratio between the two resulting values.
This produces two outputs:
- The ratio of the median Closest Distances Ratio between avatars and the reference data.
- The ratio of the outlier Closest Distances Ratio between avatars and the reference data.
Interpreting the Closest Distances Ratio
The Closest Distances Ratio ranges from 0 to 1:
-
A value close to 0 indicates that the distance between an individual and their closest neighbor is much smaller than the distance to their second closest neighbor.
This suggests a strong ability to form distinct individual–avatar pairs, which is unfavorable for privacy protection. -
A value close to 1 means that both distances are similar, preventing reliable identification of a unique association between an original individual and an avatar.
This indicates good avatar dissociation, which is beneficial for privacy.
The ratio value returned to the user is interpreted as follows:
- A value close to 100 or higher indicates that the local density of avatars relative to the original data is similar to that of the reference data, suggesting that avatars do not enable reliable linkage between original records and synthetic ones.
- A value significantly below 100 means that avatars form more isolated pairs with original data than what naturally occurs in the dataset’s variability — indicating an increased re-identification risk.
These two values can be interpreted similarly for both the median result and the outlier result.
Consider a dataset where the Closest Distances Ratio is 0.1.
This means that for a given individual, the distance to their closest avatar is on average ten times smaller than the distance to their second closest avatar.
This creates a strong possibility of pairing the avatar with that individual, representing a high re-identification risk.
If the Closest Distances Ratio ratio is 50%, this means that the local density formed between an original record and its closest avatar is twice as likely to produce distinct pairs compared to what is observed in the reference data — suggesting an increased risk of re-identification.
Metric Specificity
This metric is most meaningful when combined with the
Distance To Closest metric.
A dataset is considered at risk when both metrics are low:
- A low Distance To Closest indicates that avatars are very close to original data.
- A low Closest Distances Ratio means that individual–avatar pairs are easily identifiable, which increases re-identification risk.
Formula
For each working original , with and the distances to its closest and second closest record in the attack base:
The ratio is computed once with the working avatars as attack base () and once with the holdout ():
is the 2.5th percentile (ratios closest to 0). When the reference value is 0, the score is set to 100. Distances are Euclidean, computed in the projected space of the anonymization (first components).
How to Improve This Metric?
To improve the Closest Distances Ratio, it is recommended to increase the value of k — the number of neighbors used in synthetic data generation.
By increasing k, avatars are more evenly distributed, which increases the relative distance between an individual and their neighbors and reduces the likelihood of creating duplicated or overly isolated pairs in the dataset.