Pearson Correlation
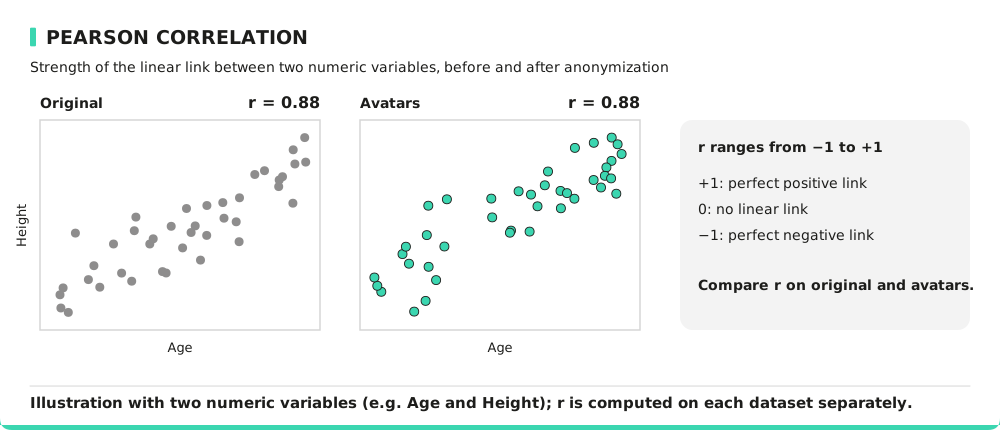
Pearson's correlation coefficient (denoted as ρ or r) measures the linear relationship between two numerical variables. It quantifies how strongly and in which direction one variable varies as the other changes. Mathematically, it is defined as:
where and are two numerical variables, and , are their respective means.
Values range from -1 to 1:
- +1: Perfect positive correlation (as one variable increases, the other does too)
- 0: No correlation (no linear relationship)
- -1: Perfect negative correlation (as one variable increases, the other decreases)
Interpreting Pearson Correlation Coefficient
A high absolute value (close to 1) indicates a strong linear relationship, while values near 0 suggest a weak or nonexistent linear relationship. However, Pearson correlation only captures linear dependencies. If two variables have a non-linear relationship (e.g., quadratic or exponential), Pearson's coefficient may be close to 0 even if the variables are strongly related.
Consider a dataset containing age and income. If older individuals tend to have higher incomes, Pearson's coefficient might be 0.65, indicating a moderately strong positive linear relationship.
If the transformed dataset has a Pearson coefficient of 0.20 between the same variables, it suggests that the transformation disrupted the original correlation, which could impact analyses based on income prediction.
Metric Specificity
Advantages:
- Simple and widely used in statistics and machine learning.
- Provides an intuitive measure of linear relationships.
- Easy to compute and interpret.
Limitations:
- Restricted to linear dependencies**: It cannot detect non-linear relationships.
- Only applicable to continuous numerical variables.
- Sensitive to outliers, which can significantly alter correlation values.
Formula
The Pearson correlation matrix is computed on the numeric variables of each dataset (constant or empty columns are removed first):
The original matrix and the avatar matrix are then compared, for instance with the Correlation Difference Ratio or the Pairwise Correlation Difference.
How to Improve This Metric?
To enhance Pearson coefficient similarity, you can adjust parameter k to help align distributions more accurately. You can also apply weighted projections by assigning higher importance to critical variables during data generation. Finally, you can use targeted data processing by apply transformations based on variable characteristics. Please consider using alternative metrics (e.g., mutual information) if the data contains non-linear relationships or categorical variables.